Open Source

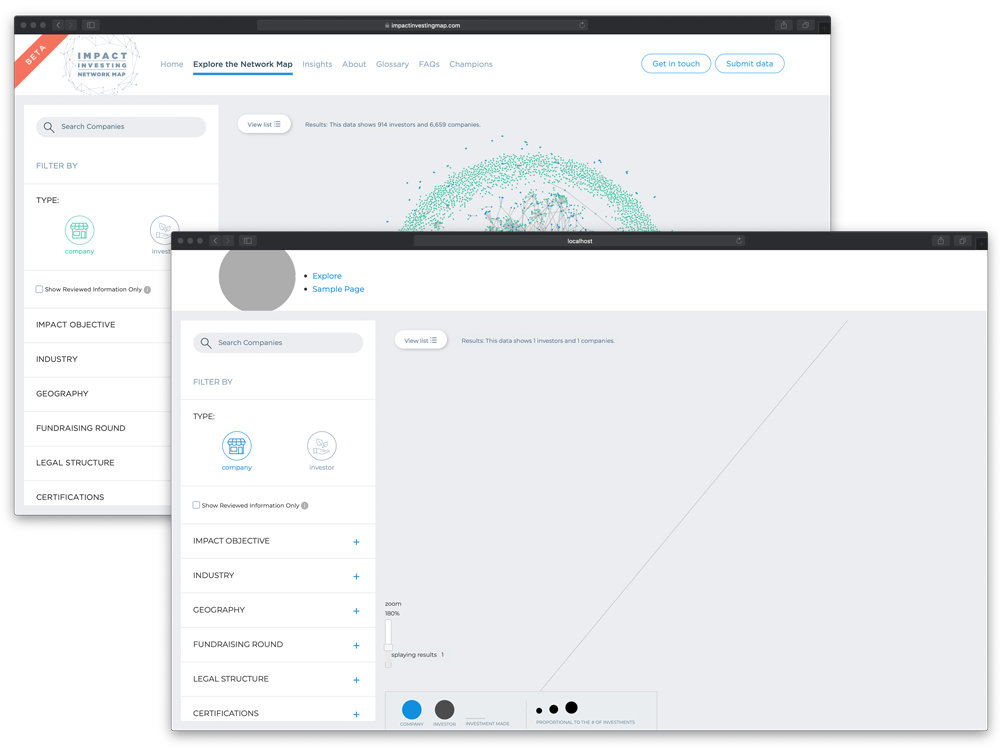
In 2017, The Case Foundation launched the Impact Investing Network Map, with data partners Impact Space and CrunchBase, to present the best publicly available data on impact investments to better inform the sector of the size, breadth and depth of the impact investing ecosystem. We believed that incorporating engaging data visualizations to display connections between investors and companies would not only bring greater accessibility and transparency to Impact Investing data but would demonstrate growth and inspire action in this catalytic movement.
Now, we are excited to announce the release of the Impact Investment Relationship Matrix (IIRMa), an open source project designed to allow all to build data visualization products to bring to life the connections between investors, companies and funds. Originally created to map the direct investments made into companies by investors in the Impact Investing field, the release of the product and code enables all to present financial data from a wide variety of fields to show the breadth, depth and the interconnections at the heart of multiple financial transactions in a graphically engaging format. As with all open source projects, it can be adjusted and modified widely, but IIRMa is ideally designed to bring greater accessibility and transparency to financial data where relationships are not easily seen and where that visualization can highlight or reveal relationships.
The code powering IIRMa, including filtering options and insights section will be open and free to use on the Case Foundation’s GitHub account, and we look forward to seeing how this visualization product will be used by others to present data in a more dynamic and accessible way.
While the basis of the Impact Investing Network Map was to display historical direct investments made into companies by investors using publicly available data, with the open sourcing of this product, you can use the code to bring your own Impact Investing data to life, expand the options and features available or, potentially, apply it to data outside the Impact Investing sector.
To learn more about how you can use this open source project to visualize your data, visit the project wiki linked below, and to explore the code itself, visit the GitHub project also linked below.


